Featured Image Credit: patch.com/illinois/naperville/
A lot of data collection goes into a stream restoration project. First, the standard year-round, watershed-wide data we collect allows us to identify potential project locations. Once we identify a project site, we perform in-depth pre-project monitoring. We measure several parameters including fish and aquatic insect diversity, in-stream chemistry, and riparian health. After the project is complete and for a time afterwards, we conduct post project monitoring of the same parameters. This allows us to compare detailed data from before and after construction to determine how much of an effect our restoration efforts have and if we are meeting our objectives.
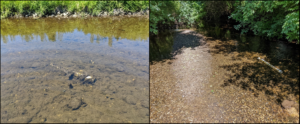
This July we had our fish crew sampling at the Blackwell Forest Preserve in Spring Brook Creek for some post-project monitoring. This stretch of river had been restored by the DuPage River Salt Creek Workgroup, which is staffed by The Conservation Foundation, in 2021 in partnership with the Forest Preserve of DuPage County and the Illinois Tollway. The dam had been removed and the impoundment drained. The river channel was reconstructed and is now gently meandering while running crisp and clear. The riparian zones were also restored with native wetland and prairie plants. Our initial post-project data indicated that the project was highly successful, and the Urban Stream Research Center has even done several mussel releases in the river. However, this newest round of sampling came with a surprise. The survey team was finding very low fish counts, and really high pH. Obviously, the fish were missing because pH was so high, but why was pH so high when it had not been before?

Typically, natural freshwater has a pH of around 7, give or take 0.5. Here they were measuring in the nines. Since pH is measured on a logarithmic scale, as pH increases by 1 its strength increases by 10, so a pH of 9 is 100 times stronger than a pH of 7. One of The Conservation Foundation’s interns came with me to take pH readings every 100 feet along the river to try and find the source of the pH increase. At the time we were assuming it was some kind of point source. Maybe there was a spill somewhere, or something flowing in from a tributary or drainage ditch. We checked in with Wheaton Sanitary District since they discharge to Spring Brook Creek, and they confirmed they didn’t have a chlorine spill (or a chlorinator for that matter. WSD uses ultraviolet light to disinfect their wastewater.) After reviewing the pH data that we collected, project construction details, and stream characteristics we concluded the most likely cause was actually excessive algae growth.
The connection between something as common as algae growing in a river and spikes in pH are not immediately intuitive but the process goes like this: When carbon dioxide from the air dissolves in water it forms carbonic acid, a weak acid, which lowers the pH. When algae and other aquatic plants photosynthesize they consume carbon dioxide from the water, thereby reducing the carbonic acid and increasing the pH. During the night when algae are instead respiring, carbon dioxide dissolves in the water again. Since we observed a large growth of algae in Spring Brook Creek, we suspect that the pH increase is driven by the algae photosynthesizing and drawing the carbon out of the water.

Of course, knowing the cause of the problem is only half the battle. How to fix it is something else entirely. There are several options for reducing the algae and thereby stabilizing the pH, although most of them are not cost effective or practical. It seems that the most reasonable option at the moment is to reduce the phosphorus concentration in the river (although I said “most reasonable”, this is still no simple task), something that may fall onto Wheaton Sanitary District’s shoulders. Thankfully, the DuPage River Salt Creek Workgroup, which is staffed by The Conservation Foundation, is already well into the process of developing a Nutrient Implementation Plan that will address this and other nutrient related issues, and lend support to Wheaton Sanitary District and all other member treatment plants in our watershed. While the restoration project at Blackwell Forest Preserve made an incredible difference to the river health, it seems we aren’t completely done there yet, and goes to show that ecological restoration just won’t ever be as simple as we’d like.