It can be really difficult to know how clean and healthy the river running through your neighborhood or town really is. In fact, if it was easy I wouldn’t have a job, or at least not this one. River health is complicated as it ties in not only the water itself, but the land that makes up the river channel, and the land all around the river (riparian zone), as well as the entire watershed area. It also includes all the plants, fish, insects, and other organisms that live in and near the river. Pollution, nutrients, and chemical properties like pH are all factors as well. And we can’t even change any one factor at a time because most aspects of a river affect and influence several other parts. The cherry on this very messy sundae is that depending on what the water is used for, a “healthy” stream can have moving goalposts. A river will have strict water quality criteria if it is a source of drinking water, but a nearby river that isn’t even used for fishing or swimming will be much less strict.
If you have concerns or questions about your local river or lake, the good news is that you don’t have to spend years and years studying and conducting research. The US Environmental Protection Agency has a new web tool called “How’s My Waterway” that contains answers to many questions regarding river status. Last month I watched a webinar detailing how to use the website and it is full of very interesting information, and it is very user friendly. This tool is intended to be used by the public, so you won’t have to pull teeth or pay a fee to get information. It contains details about local waters using data that has been collected from a variety of sources: Federal, State, Tribal, local agency, and NGO data are all present and neatly compiled. With all the data, you can view information on a community, statewide, and national level!
To learn about the health of your river all you have to do is type in your zip code. The local river, color-coded by health level, will pop up with a watershed boundary already defined. Clicking on your local river pulls up info about how the river is used, any impairments present, and all identified issues. Using the various tabs for swimming, drinking, fish consumption, and more, you can easily find out how safe the river is for recreation and wildlife. If there are concerning issues in your stream, clicking on an issue brings up a tab telling you in detail about the problem, and what you can do as an upstanding individual to help!
If you are curious about the finer details, there is also a tab that allows you to view every monitoring station in the watershed and view and download their data. Furthermore, you can view all the permitted dischargers along the river and view their permits, and any violations they have had in the past. This allows you to check if someone upstream of you is potentially causing a health hazard for you, and all violation documentation is viewable to the public. Finally, for those of you who want to be even more involved, there are links to advanced topics, as well as options to generate maps, and even ways to add your own data to combine with the online tools enabling you to dive deep into any question you may have.
I highly encourage anyone who is interested in the water quality of their own hometown to take a little bit of time and explore this website. It has a lot of useful tools that will help you get familiar with and visualize your own watershed. As you browse you may notice that many rivers and lakes are purple indicating that there is no data. To that end, some of this data comes from River Watch and other organizations that use volunteers. So, if your local river is unmonitored, maybe finding the time to collect a few samples one weekend will benefit everyone around!

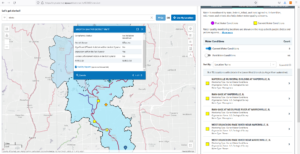
Once you designate a location, you can select a river and see its current condition. Here you can see I selected Spring Brook, currently impaired for salts (among other things). If you need more details on an issue or are curious about how to help, the glossary pops up with info and additional links.


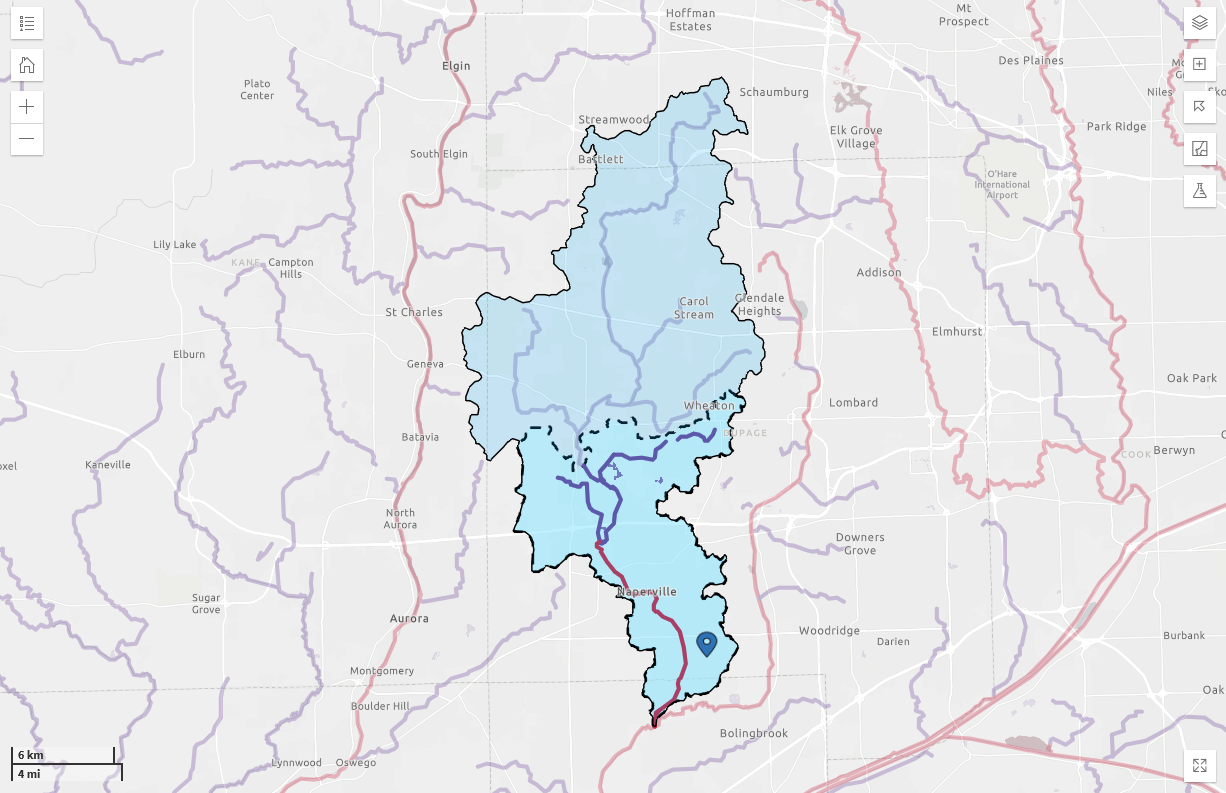
My favorite tool on this webpage is a watershed delineator. Once you type in your location (I used a Naperville zip code, 60565) it’s a simple one-button click and you can see the entire watershed that drains into your area. It’s easy to see who is above you and where to look.
You can also view all past and current monitoring stations, as well as all National Pollutant Discharge Elimination System (NPDES) permit holders. These are primarily wastewater treatment plants. Here you can see that Wheaton Sanitary District has had no violations in the last five years, and is current on inspections. If you want more info, the facility report is included! (You can also internet search the NPDES ID).
Images from https://mywaterway.epa.gov